Performance and Load Testing with JMeter for beginners

Software testing is required to ensure that the application runs without any failures and software testing is a necessity unless and until there is software development. Before starting off, let’s firstly discuss what is load testing and performance testing.
Performance Testing:
Performance testing is the process of evaluating how a system performs in terms of responsiveness and stability under a particular workload. Performance testing is mainly done in order to examine speed, robustness, reliability, and application size. Performance testing examines:
- Browser, page, and network response times
- Server request processing times
- Acceptable concurrent user volumes
- Processor memory consumption; number and type of errors that might be encountered with app
Load Testing:
Load testing falls under performance testing which determines how the software application behaves while being accessed by multiple users simultaneously.
What is Jmeter?
Apache JMeter is a testing tool that is used for analyzing and measuring the performance of different software services and products. It is a pure Java open source software used for testing Web Applications or FTP applications. It is a 100% pure Java application designed to load test functional behavior and measure performance.
Working of Jmeter

JMeter simulates a group of users sending requests to a target server, and return statistics information of the target server that describes the performance of the target server via tables, graphs, etc.
Jmeter Elements
There are different components of Jmeter which are called elements and each element are designed for a special purpose. Some of the important elements of Jmeter are:
- Thread Groups
- Samplers
- Listeners
Thread Groups:
Steps to add a thread group:
Add>>Threads>> Thread Group

In simple words, Thread Groups is a collection of threads. Each thread indicates the total number of users performing the script execution. It is the base element for every JMeter test plan. The thread group allows you to set the number of threads for each group. If the number of threads is set to 100, JMeter will create and simulate 100 user requests to the server under test.
Elements of Thread Groups
Ramp-up Time: Ramp-up time is the time it takes to execute all threads. For eg: If we have 20 threads load, and the ramp-up period is given as 20 seconds, then JMeter will take 20 seconds to get all 20 threads up and running i.e. 1 second per thread.
Loop Count: Loop count tells JMeter how many times to repeat your test. If you enter a loop count as 1, then JMeter will run the test only once. If we want our test plan to run repeatedly, we must select the infinite checkbox which runs for infinite times.

Here, the total number of thread i.e user is given as 10 which means JMeter will create and simulate 10 user requests to the server under test. The ramp-up period is 10 which indicates that JMeter will take 10 seconds to get all 10 threads up and running i.e. 1 second per thread and the loop count is 1 which means Jmeter will run the test only once.
Samplers
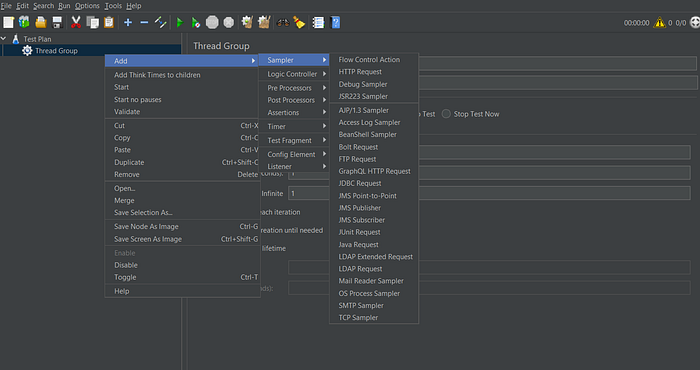
Samplers in JMeter are added as a child of Thread Groups. There are different types of samplers that are provided by Apache JMeter. These samplers are used to send different types of requests to the server.

Steps to add a sampler:
Thread group>>Add>> Sampler

Some of commonly used samplers provided by Apache Jmeter are:
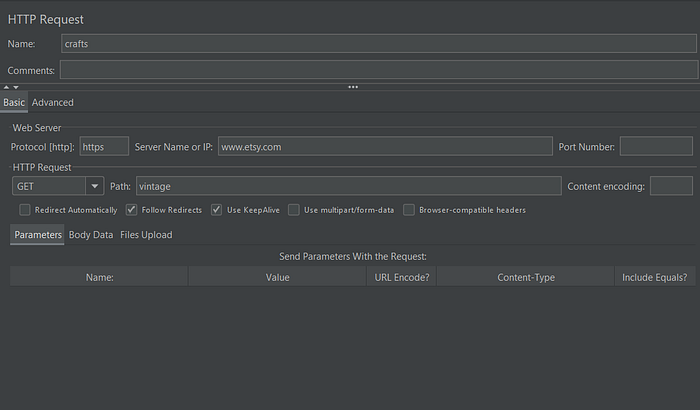
- HTTP Request: HTTP Request sampler is mostly used sampler for testing web applications. It is used to send HTTP/HTTPS requests to the target web server.

The server name or IP indicates the link of the website under test (eg:www.etsy.com). The Path field indicates which URL request you want to send to Etsy server. For example, if you enter “vintage” in path field. JMeter will create the URL request https://www.etsy.com/vintage to Etsy server.
FTP Request: FTP stands for File Transfer Protocol, it lets the user transfer files to the server, that is download or upload file requests to the server.
JDBC Request: JBBC Request sampler is used to test databases. It lets the user send JDBC Requests consisting of SQL queries to the server database. We must set up a JDBC connection in order to use this sampler.
SMTP Sampler: SMTP Sampler is used to test a mail server. It is used to send email messages using the SMTP protocol.
Listeners
In simple words, Listeners is used to view and analyze the result of performance tests in tabular or graphical form. After all the test cases are executed, the listeners show the result of those executed tests in pictorial representation in the form of tables, graphs, trees, or simple text.

These are some of the data that are provided by listeners:
- #Samples: Total number of Samples.
- Average: Average Time.
- Min: Minimum time a sampler has taken to go to the server.
- Max: Maximum time request taken to go to the server.
- Status: Represents as test Pass/Fail symbol.
- Error%: Number of error sampler/Total number of Sampler.
- Throughput: Sample received by the server per second.
- Received KB/second: Defines how many kilobytes per second received by the Client.
- Sent KB/second: Kilobytes per second are sent to the server.
- Latency: Delayrecieved in response by the application for the request sent by the user.
- Std Dev: Deviation from the average value of sample response time.
- 90% Line: Represents that 10% of the samplers have exceeded time to reach the server.
- 95% Line: Represents that 5% of the samplers have exceeded time to reach the server.
- 99% Line: Represents that 1% of the samplers have exceeded time to reach the server.
View results in Tree

View Results in Table

Graph Results

Summary Report

Aggregate Report

Generating JMeter Load Test Dashboard Report
JMeter supports dashboard report generation of results from test plans in graphical and statistical view. Its default behavior is to read and process samples from CSV files to generate HTML files containing graph views. It can generate the report at the end of a load test or on-demand.

Syntax for executing in non-GUI mode
jmeter -n -t(path of .jmx file) -l(path of jmeter.jmx file) -e(generate HTML reports) -o(path of output folder where you want to save your html file)
- Jmeter -n: Run jmeter script in non GUI mode.
- Jmeter -t: pick JMeter.JMX file and will execute it. Path of JMX file is taken which is saved under bin folder.
- Jmeter -l: path where we want our executed results to be saved into.csv format.
- Jmeter -e: convert .csv file into HTML format.
- Jmeter -o: saves the HTML results into a given path along with the HTML file name.

Report Overview
- Apdex (Application Performance Index) is used in terms of measuring the performance of software applications. Its purpose is to specify a uniform way to analyze and report whether the performance meets the user's expectations.
- Requests Summary shows the percentage of success and failure percent of the test.
- Statistical table represents the summary of all metrics per transaction.
- Error table provides the summary of all errors.
- Response times Over Time is a graphical representation of average response time over time.

- Response Time Percentiles Over Time (successful responses) is a graphical representation of Min/Max and 3 percentiles response time over time.

- Active Threads Over Time represents the number of active threads over time.

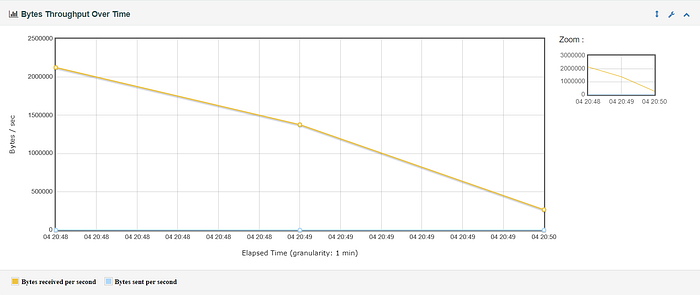
- Bytes throughput Over Time represents the throughput of received and sent data over time.

- Latencies Over Time represents the average latency time over time.

- Connect Time Over Time represents the connection time over time.

- Hits per second represent the rate of finished requests over time.

- Response Time vs Request per second represents the median and average response time depending on the number of current requests.

- Latency vs Request per second represents the median and average latency time depending on the number of current requests.

- Response time Overview

- Times vs Threads represents the average response time depending on the number of currently active threads.

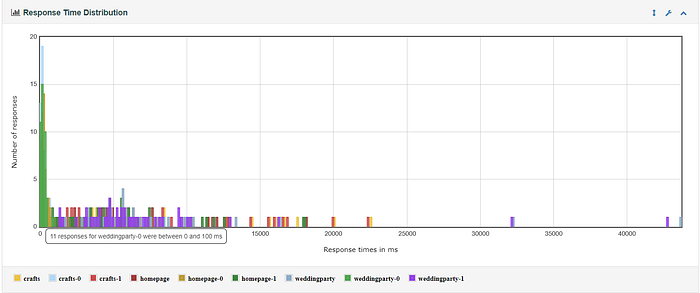
- Response Time Distribution represents the distribution of the samples depending on their elapsed time and name.

To know more about how to get started with software testing check out Software Testing Fundamentals.
References:
